Help / Tutorial
Overview
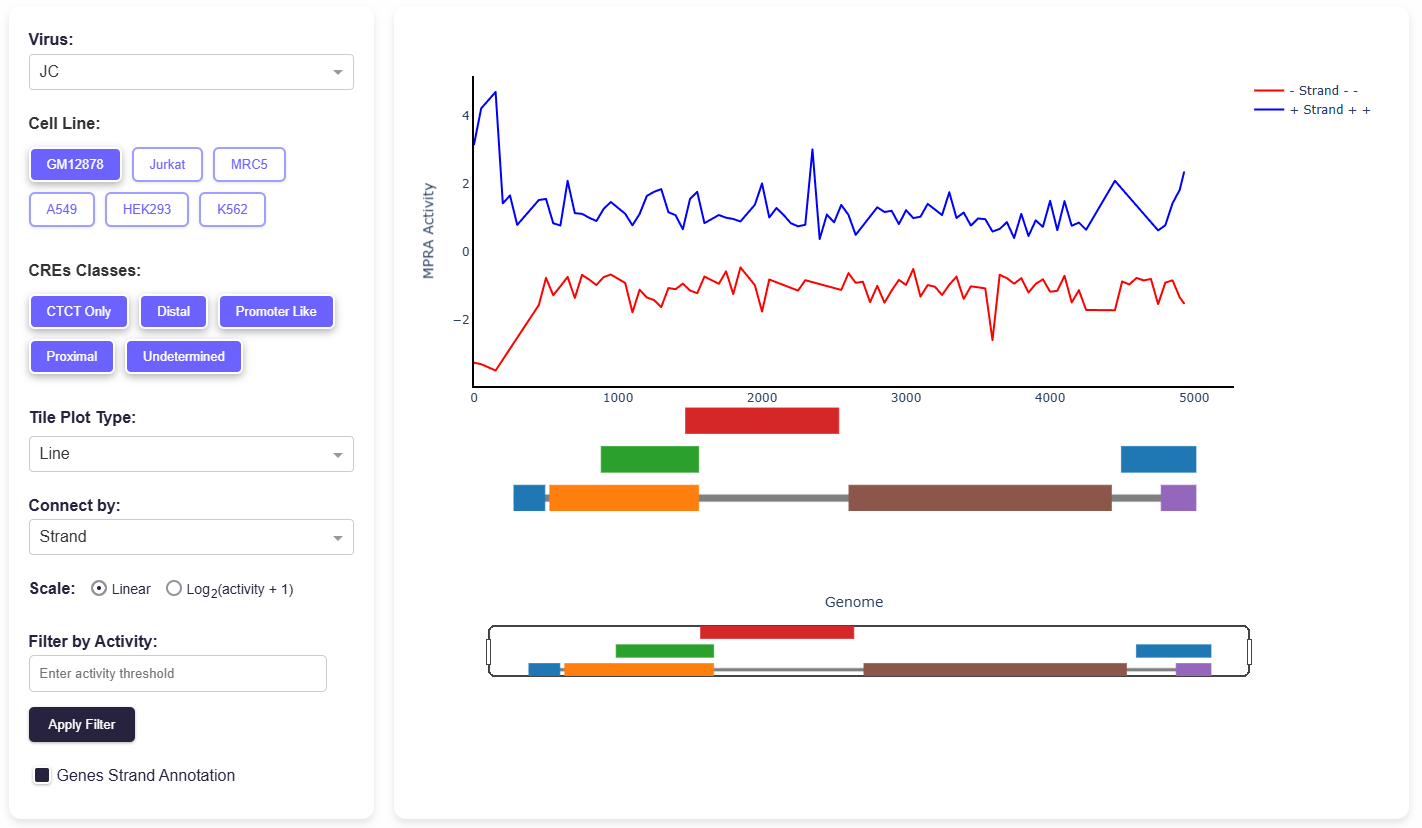
This visualizer has two main panels:
- Plots (Right Panel): Contains two subplots:
- Activity Data Plot — displays MPRA activity data in different formats based on selections in the left panel.
- Genome Plot — shows the genome region with a range slider for exploration, zooming, and panning.
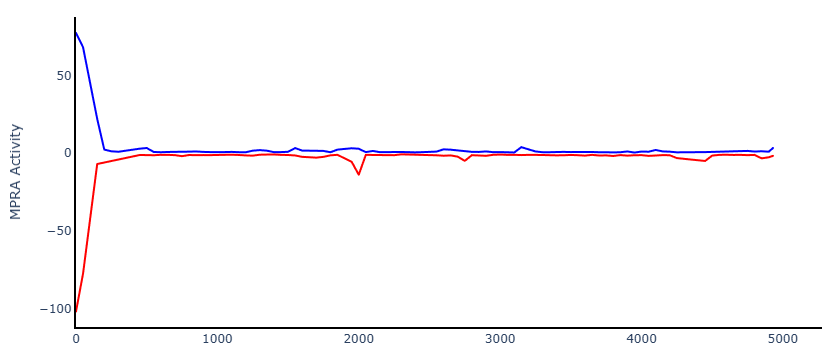
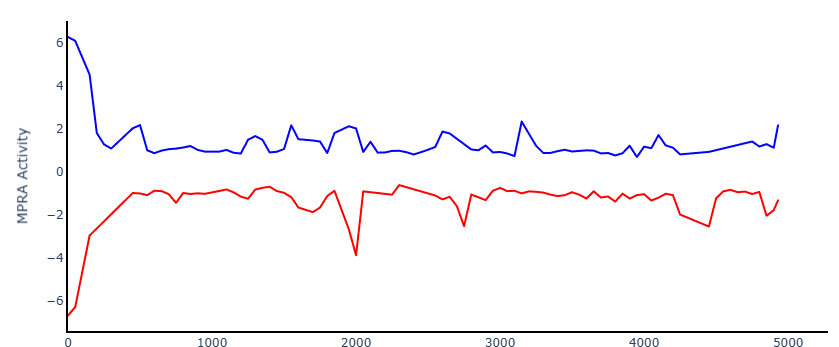
You can zoom and pan using mouse scroll or built-in controls. Activity values may be positive or negative depending on the strand of each tile, to improve visualization clarity.
- Panel of Options (Left Panel): Used to customize the visualizations and filter data.
Panel of Options (Left Panel)
Virus Selection
Select one dsDNA virus from the following families:
- Adenovirus
- Papillomavirus (HPV-5 not available yet)
- Polyomavirus
- Herpesvirus (largest genomes)
Multibutton Selections
Cell Line Selection
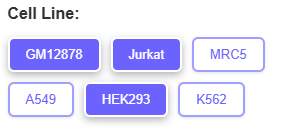
Choose one or multiple cell lines from which MPRA data was obtained:
- GM12878
- Jurkat
- MRC5
- A549
- HEK293
- K562
CREs Class Selection
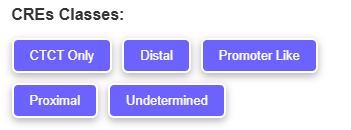
Choose one or multiple CREs categories to show:
- CTCF Only
- Distal
- Promoter Like
- Proximal
- Undetermined
Plot Options
Tile Plot Type
Select one of three visualization types:
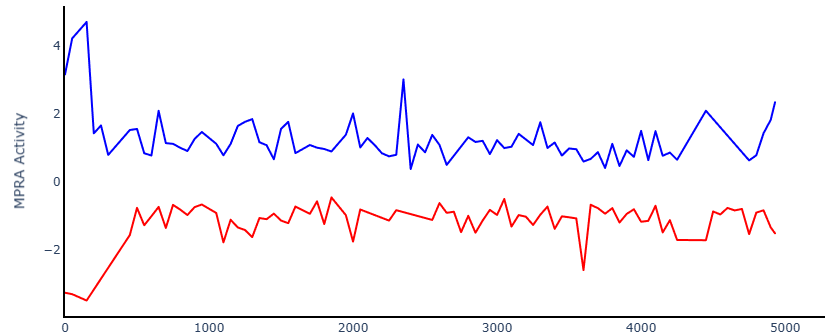
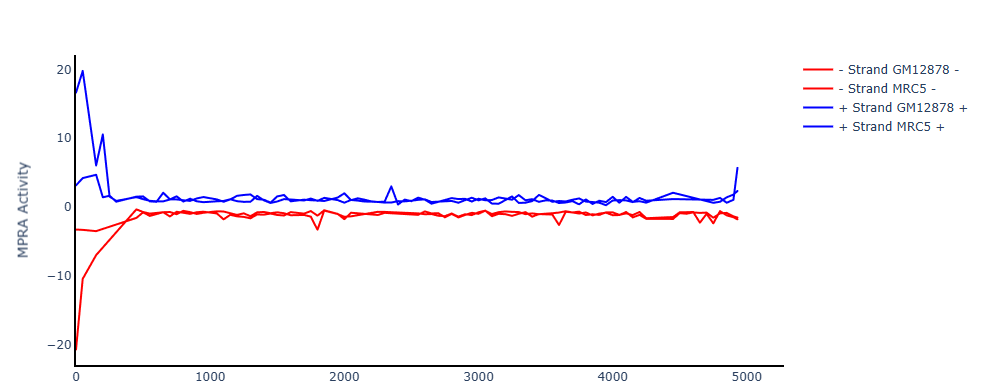
- Line: Connects tiles according to the "Connect By" option. Shows
activity on the y-axis aligned with genomic positions. Note: "Color By"
is disabled for this view.
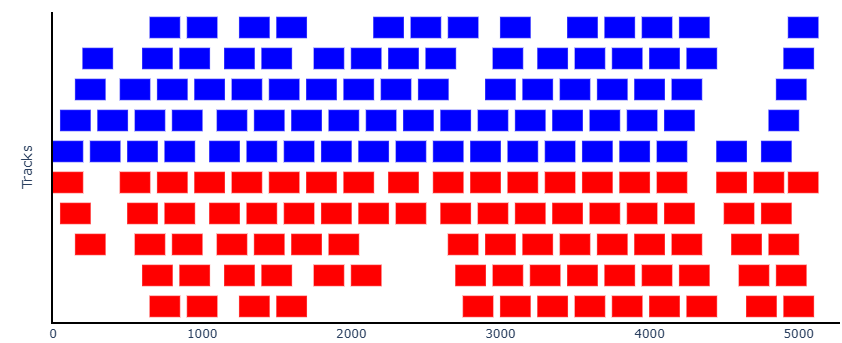
- Bar: Represents each tile as a 200 nt wide bar. Bars are stacked
in tracks to avoid overlap and improve readability.
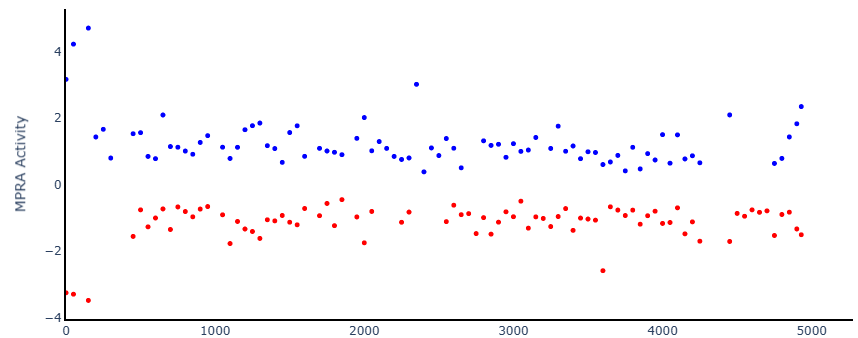
- Dot: Displays tiles as scatter points positioned by genome
location and activity value.
Connect By
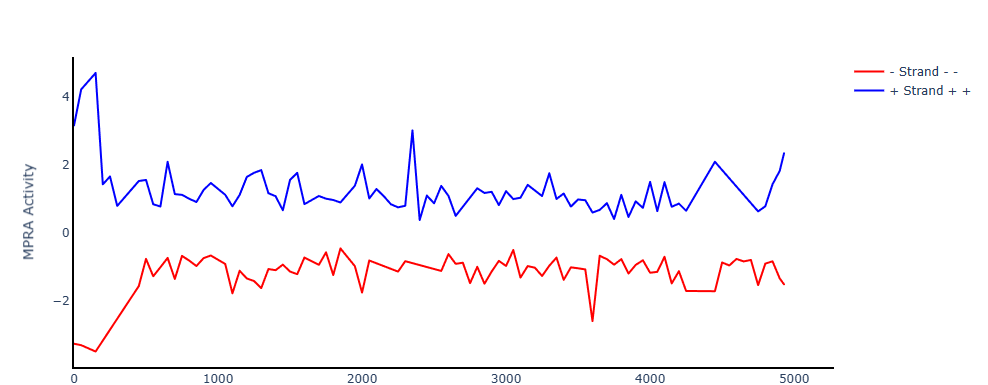
Available only for the Line plot. Determines how tiles are connected:
- Strand (default): connects tiles at the top or bottom depending on the strand.
- Cell Line: connects tiles grouped by selected cell lines.
Color By
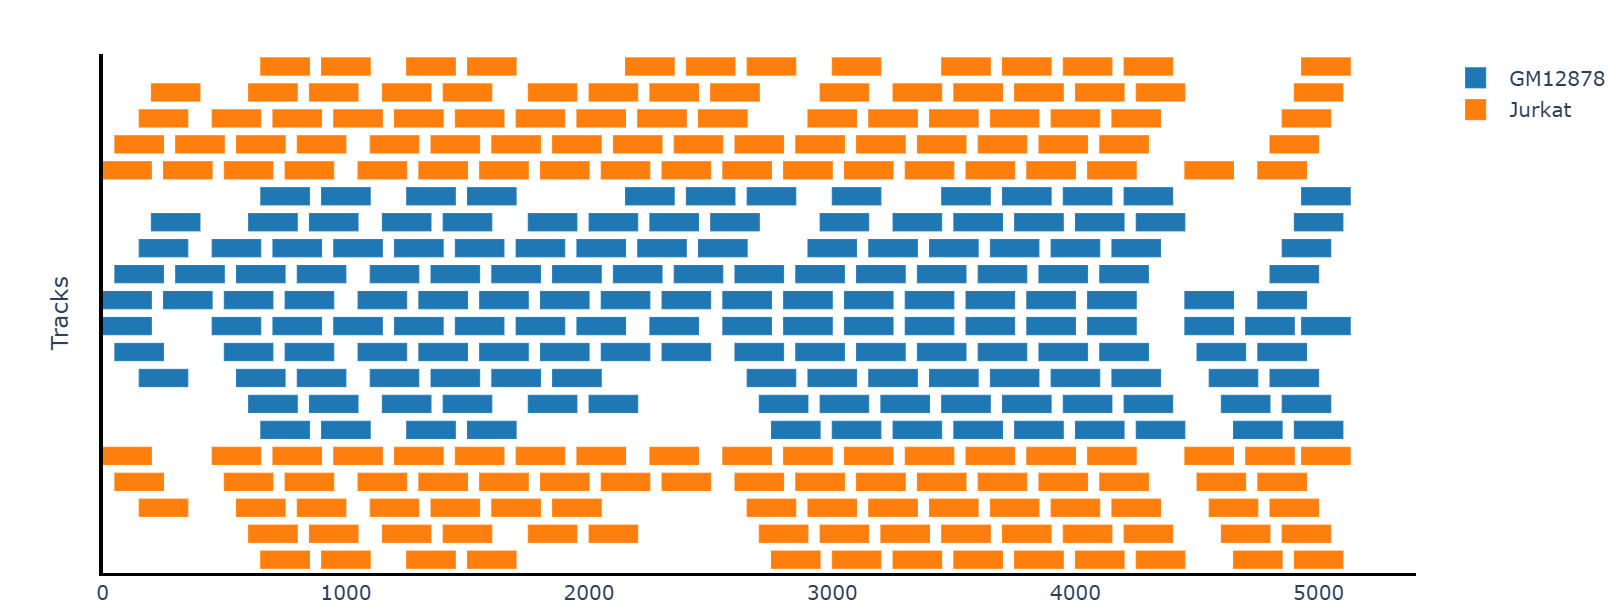
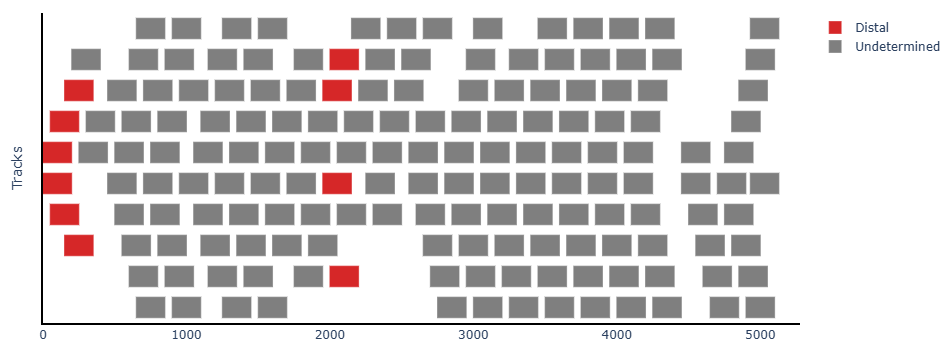
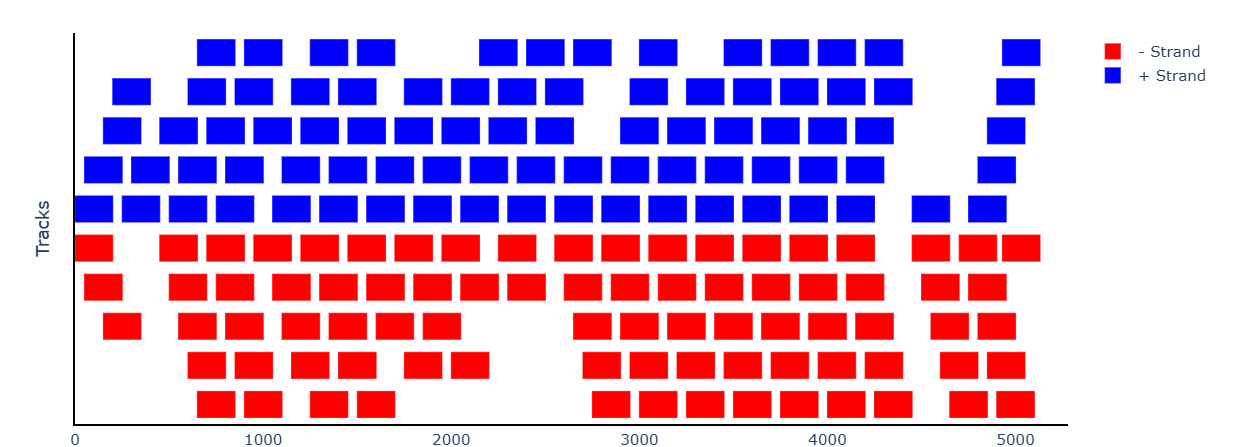
Available for Bar and Dot visuals. Tiles are colored according to:
- Cell Line
- CREs Class
- Strand
- Activity (only for Bar plot): uses a continuous color scale representing activity values.
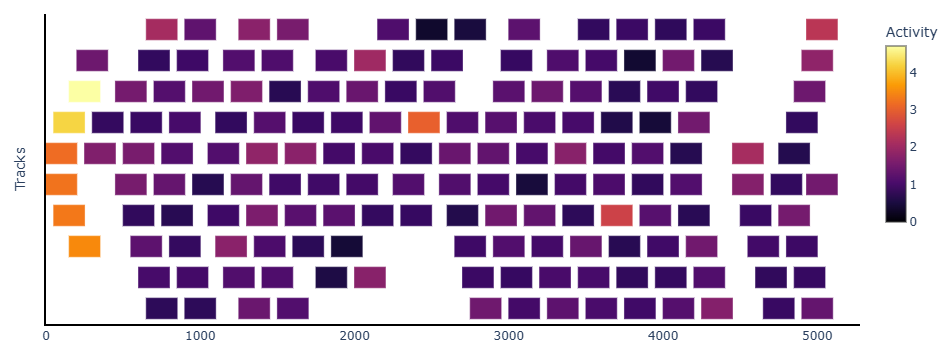
Scale
Choose the scale for activity values:
- Linear
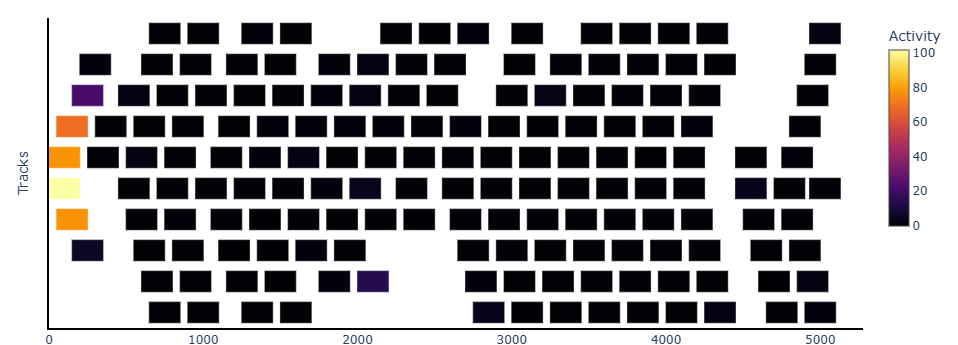
- Log2(activity + 1) — useful to compress large value ranges and highlight subtle differences.
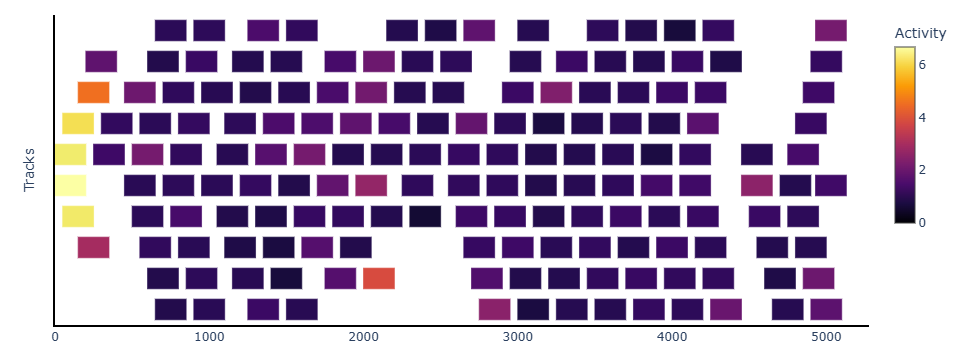
Filter by Activity
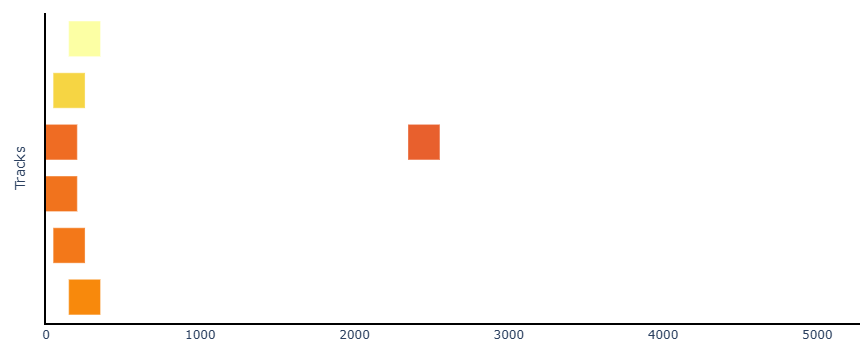
Set a threshold value and click "Apply Filter" to display only tiles with activity values meeting the criteria.
Before (0)
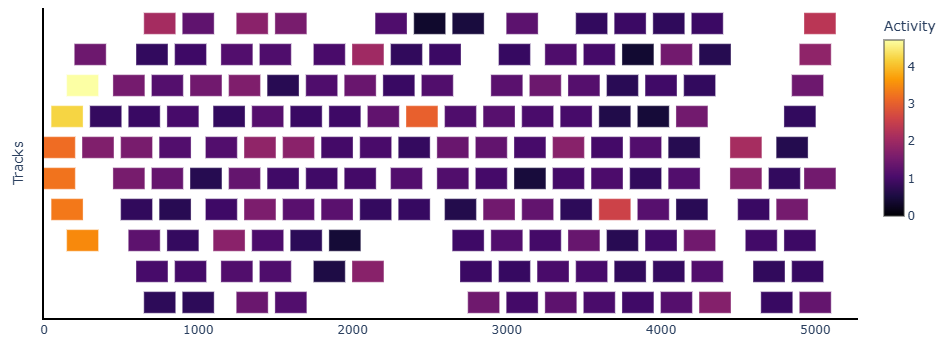
After (3)
Genes Strand Annotation
Toggle this checkbox to display genes from the + strand at the top and genes from the − strand at the bottom of the genome plot.
Before

After

Additional Notes
-
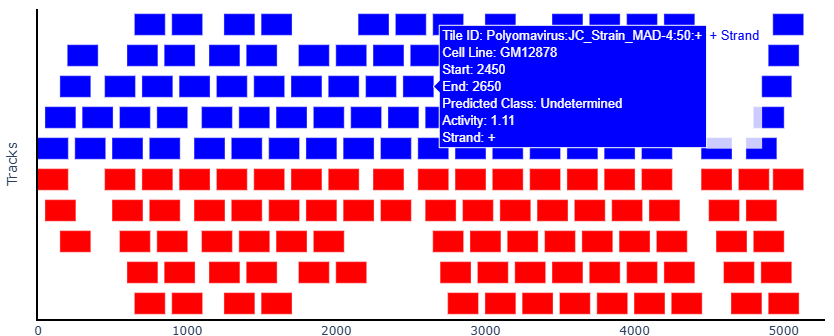
Hovering over any tile shows detailed information: ID, Cell line, genome position, strand, and activity value.
-
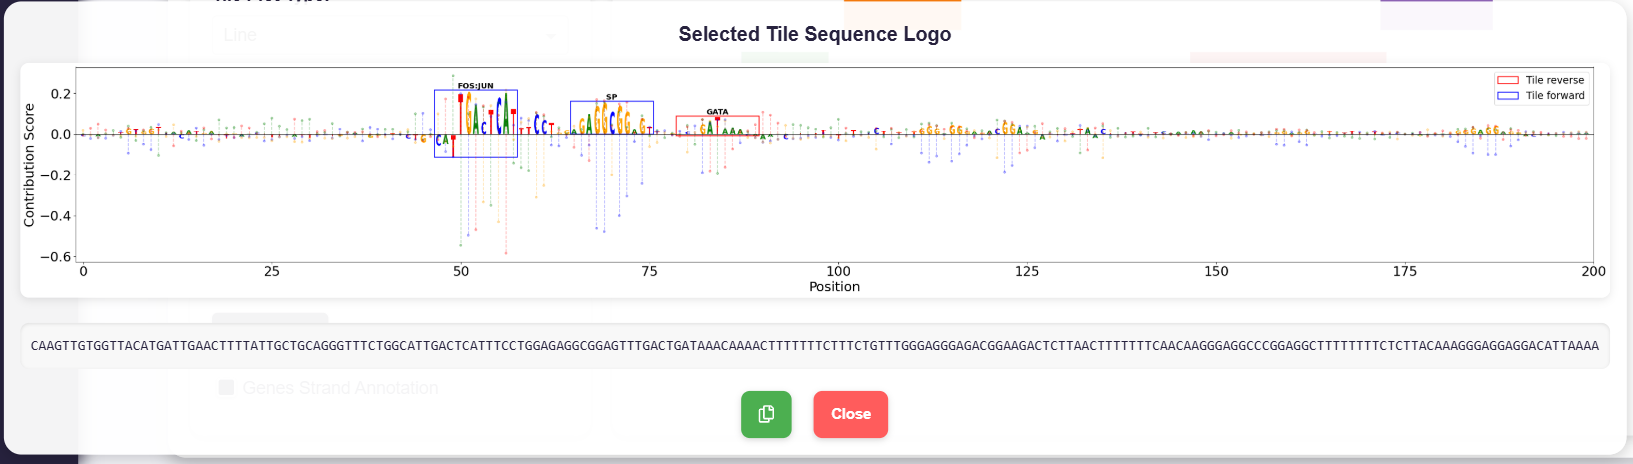
Clicking a tile from the K562 cell line opens a panel with:
- A sequence logo plot from mutagenesis assay data.
- The tile's nucleotide sequence, which can be copied manually or using the copy-to-clipboard button.